Available translations: Cymraeg

The nature of decision-making around land management, agriculture and the environment is inherently complex due to the range of interdependencies between different sectors and the varied actors within them. The problem faced by many traditional modelling approaches is that they address these sectoral challenges independently without being able to explicitly represent the implications for other sectors.

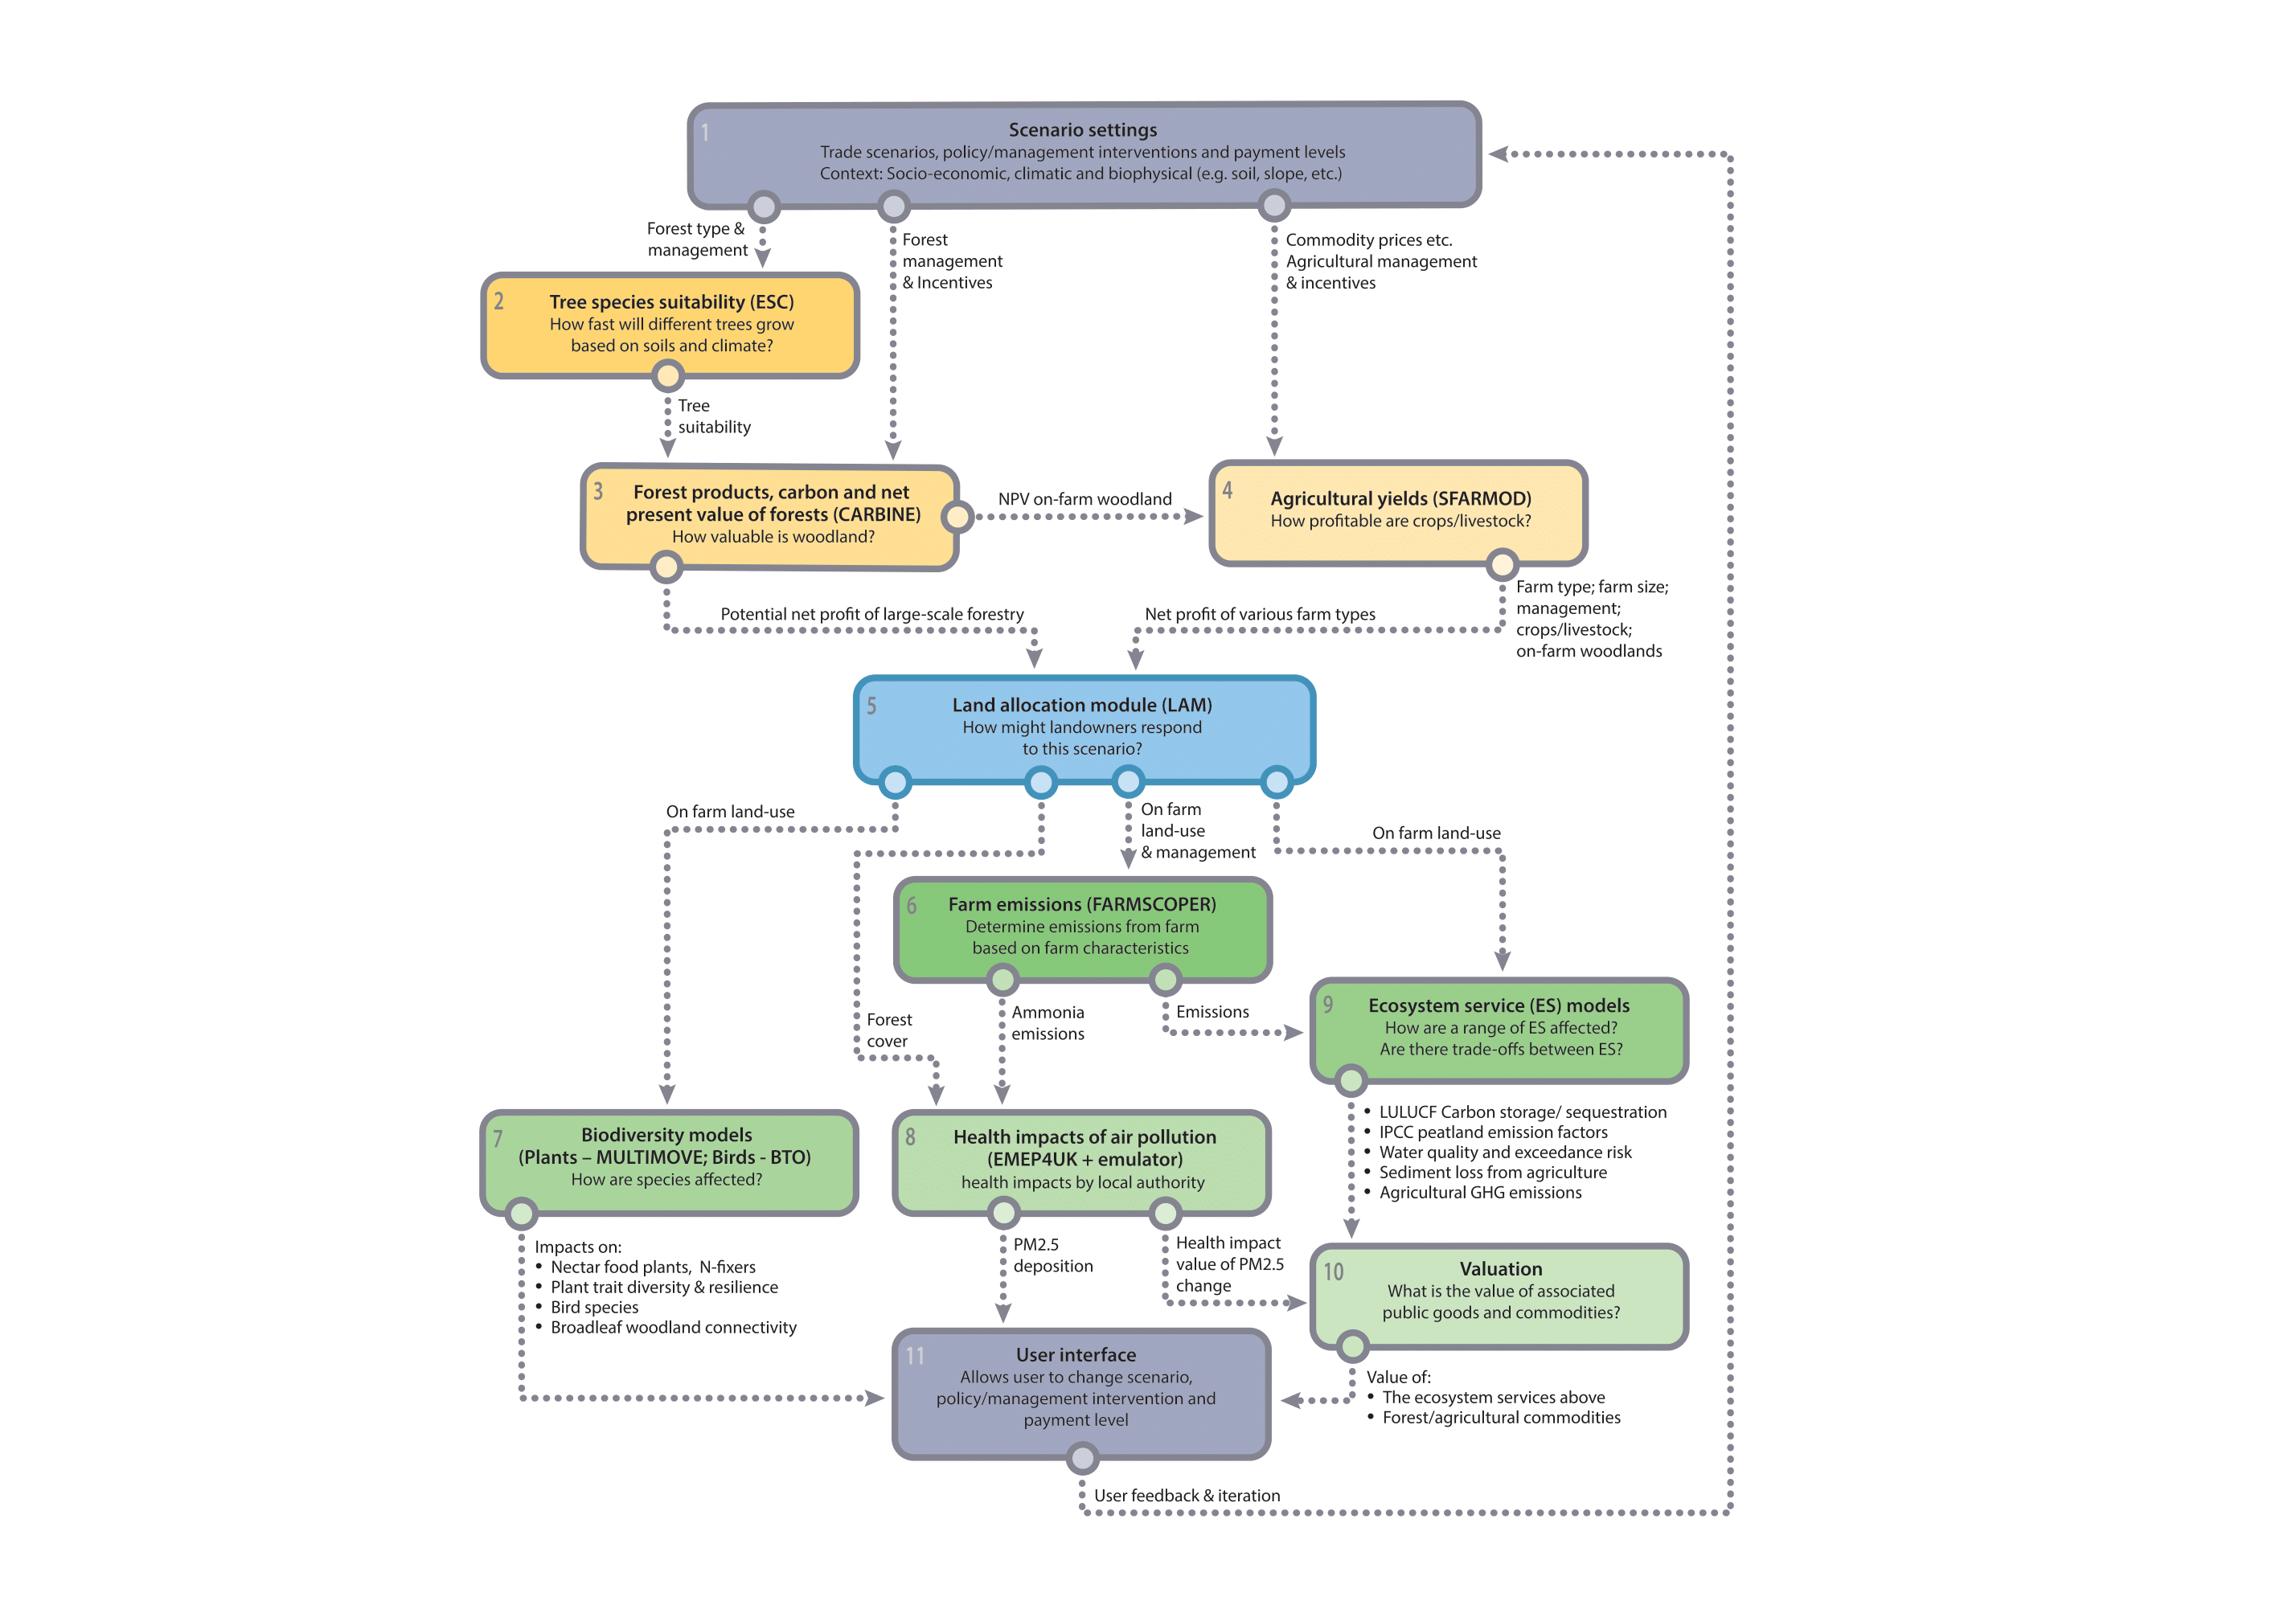
To address this challenge of sectoral interdependence the IMP has been developed as an integrated system of 11 inter-connected models. The models have been linked together by establishing data-flows between models across a model chain. These data-flows represent the interdependencies between different sectors or impacts. The model chain is run for a range of scenarios whose settings are co-created with the relevant Welsh Government policy team. Outputs from the model chain are ingested into a user interface, which is being designing with Welsh Government to enable interactive exploration of the results.

The components of the Integrated Modelling Platform are:

IMP Structure

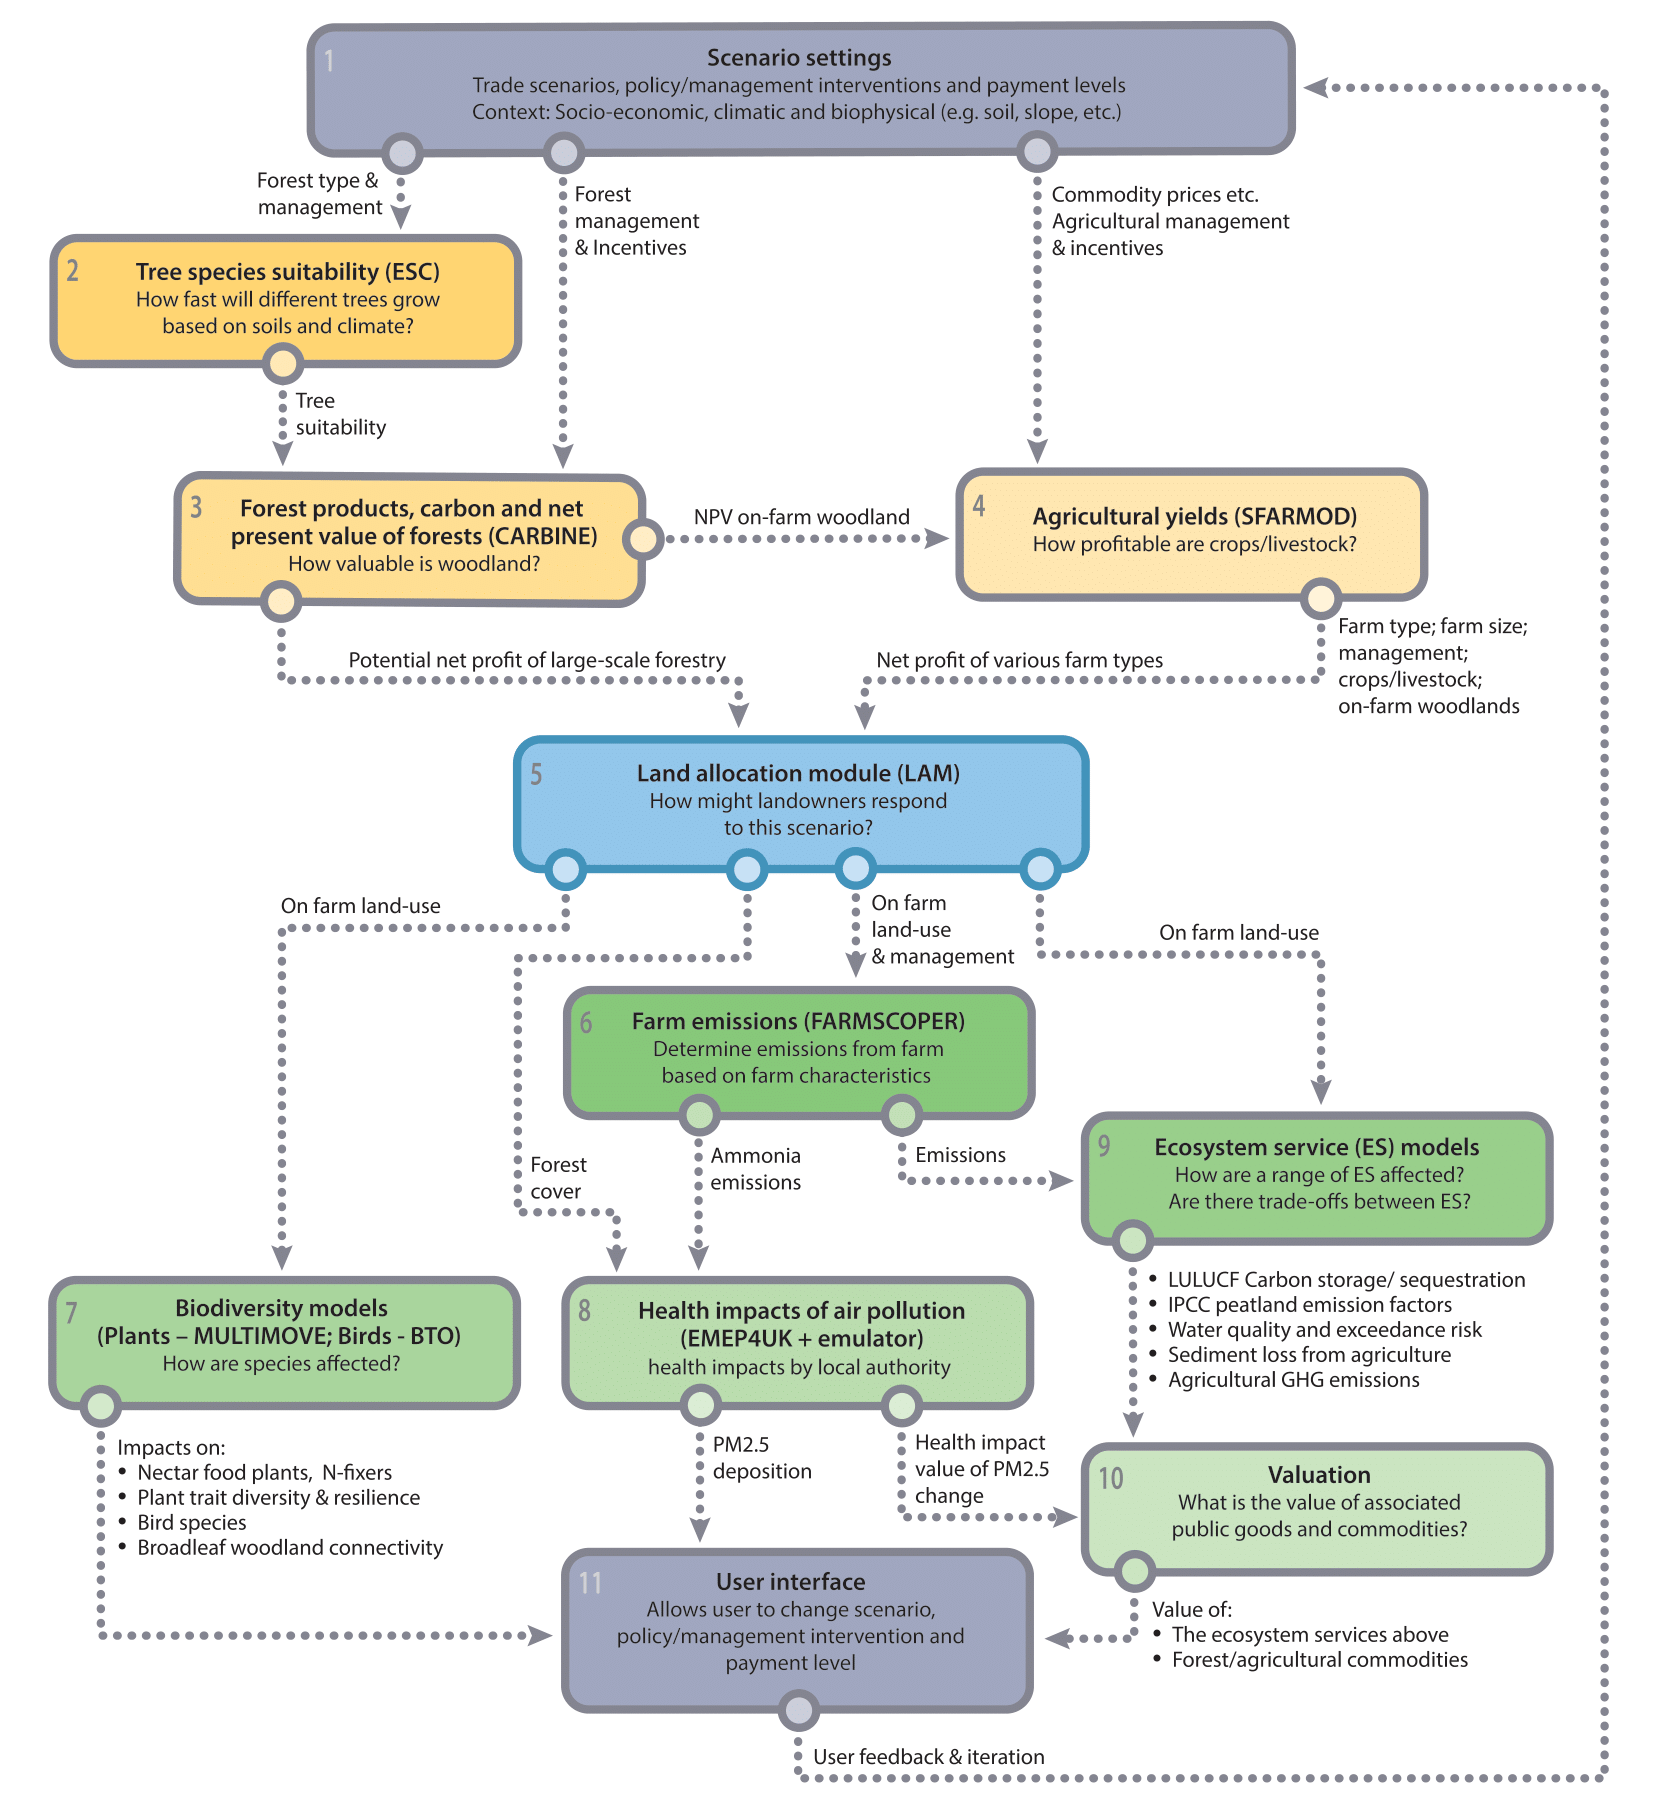
Box 1:  Input scenarios and parameters.

Box 2:  Ecological Site Classification (ESC) is a decision support system (DSS) tool estimating suitability for a range of tree species, driven by climate and site condition.

Box 3:  CARBINE is an analytical forest sector carbon accounting model and forecasting model for tree growth and timber production.

Box 4:  SFARMOD (Silsoe Whole Farm Model) is a mechanistic linear program of long-term farming which optimises land use based on profit maximisation or weighted multiple objectives. 

Box 5:  Land Allocation Module (LAM) projects changes to land uses through a set of rules and thresholds; comparing a current farm type with the most profitable alternative farm type.

Box 6:  FARMSCOPER tool integrates calculations of pollutant emissions with mitigation measure cost and effectiveness for prioritisation of mitigation measures across multiple pollutants.

Box 7:  Ecosystem service models simulate a range of ecosystem services based on changes in land use, climate and other drivers. Specifically, carbon sequestration from land use, land use change and forestry, GHG emissions from agriculture and peatlands, and water quality.

Box 8:  Biodiversity Models:

a) MultiMOVE estimates effects of climate, fertility, alkalinity, etc. on habitat suitability for plant and lichen species.
b) BTO models: National-scale pattern analyses using grid square data (1km) for simulating distribution, abundance and population changes for a range of terrestrial breeding bird species.
c) Broadleaf woodland connectivity model based on the distance species can travel (dispersal distance) and minimum habitat area requirements (patch size).

Box 9:  Health impacts of Air pollution: a meta-model based on the EMEP4UK atmospheric chemistry transport modelling system which simulates air pollutant concentrations and deposition in response to land use change.

Box 10: Valuation – the valuation of the outputs of other models; specifically the ecosystem services and public goods, valued using monetary or non-monetary methods.

Box 11: User interface: Graphical interface for exploring the IMP map and graph-based outputs.

What Do the Models Do and How are They Combined?

Farm Profitability

The whole farm model, SFARMOD, estimates the profitability of various agricultural activities within each full-time farm holding in Wales.

To do so, SFARMOD uses input scenario information as well as user-specified management and policy options. These options include agricultural subsidies and rules relating to the area of land under different productive or unproductive management types (e.g. sheep, wheat, fallow, etc.). Given a particular scenario and set of management and policy options, SFARMOD output is an estimate of the profitability of both the current farm type and all potential alternative farm types for each farm holding.

Woodland Productivity

The forestry models, ESC and CARBINE, collectively estimate the productivity and carbon storage potential of forestry, based on the input scenario information and management options. Information on the price of timber as well as the costs of establishing and managing forestry is then used to estimate the profitability of five different forest management options at the scale of a farm holding.

These outputs are passed to SFARMOD to allow on-farm woodland to be considered as a potential alternative land use within a farm.

Land Allocation

Profitability of the different farm types is compared within the Land Allocation Module (LAM). Transitions from current land uses are projected through a set of rules and thresholds comparing the current farm type with the most profitable alternative farm type.

If the current farm type is viable, the LAM considers whether there is a more profitable alternative farm type. If there is, and the increase in profitability from the new farm type is sufficient to make transition worthwhile (given the capital investment needed to transition) the modelled farm will change land use to the more profitable farm type; if not, farm land use will not change.

If the current farm type is not viable, the modelled farm will be projected to change to the most profitable viable farm type. If no viable farm type is available, the LAM will consider whether forestry is a profitable alternative instead. If so, forestry will be established, and if not, the modelled land will be considered to be go through natural succession in the modelled outputs.

Agricultural Emissions

Once the predicted land allocation is established for each farm, the agricultural emissions model, FARMSCOPER, determines the emissions from each modelled farm based on their size and typology. Emissions include nutrients (e.g. P), greenhouse gasses (e.g. CO2) and pollutants (e.g. NH3-N), and may be affected by user specified mitigation measures.

Ecosystem Services

The Ecosystem Service (ES) models use the information from the LAM on changes in on-farm land use and management to estimate changes in carbon sequestration due to land use, land use change and forestry (LULUCF) and changes in peatland use. This information is combined with the information from FARMSCOPER on greenhouse gas emissions from agriculture to estimate overall changes in carbon. The ES models also use information passed from FARMSCOPER to assess changes in water quality (e.g. Water framework Directive P status, drinking water N status, sediment loss from agriculture).

Biodiversity

Habitat suitability for plant and bird species is simulated using the MULTIMOVE and BTO models using information on on-farm land use and land management from the LAM. MULTIMOVE estimates habitat suitability for a wide variety of plant species, including woodland and arable specialist plant species and positive Common Standards Monitoring (CSM) species (specialist plants of other semi-natural habitats, e.g. lowland grassland, lowland wetlands, lowland heath and upland habitats).


Bird population models developed by the British Trust for Ornithology are used to predict species-specific abundance for 68 bird species associated with different habitats across Wales.

In addition, the broadleaf woodland connectivity model estimates the effect of new on-farm woodland and afforestation (as passed from the LAM) on connectivity between existing woodland patches.

Air Quality and Human Health

The EMEP4UK meta-model uses information passed from the LAM on new woodland and information passed from FARMSCOPER on ammonia emissions from farms to estimate changes in fine particulate matter (PM2.5) concentration. Implications of these changes for human health, in terms of life years lost, are then computed.

Valuation

In the final stage of the IMP integrated chain, ecosystem services/public goods are valued using monetary values for carbon, water quality and the health impacts of air pollution. ES valuation follows a hierarchy of valuation methods (market prices, avoided costs, revealed preference and stated preference) using value transfer approaches and following best-practice guidelines.

The monetary values are presented alongside physical values for all indicators, including biodiversity, and effects on farm business income.